Solar Panel ROI Calculator: Estimate Your Savings in 2025
Going solar is one of the most significant financial decisions a homeowner can make, and it’s a decision that requires a clear understanding of the return on investment (ROI). While the environmental benefits are clear, the financial case for solar is what makes it a truly strategic choice. A well-designed calculator is the key to accurately estimating your solar savings. This guide will provide a professional overview of the critical factors you need to consider, from installation costs and energy price inflation to tax incentives and long-term system performance.
Why Use a Solar Panel ROI Calculator?
Solar ROI calculators are essential tools for anyone considering an installation. They provide a standardized, unbiased way to assess the financial viability of a solar system by allowing you to project payback periods, total savings over the system’s lifetime, and the crucial break-even point.
The Power of an Accurate Calculator
A well-designed solar calculator goes far beyond a simple energy savings estimate. It allows you to model various scenarios to find the perfect fit for your home and budget.
- Standardized Assumptions: A reliable calculator uses standardized assumptions for key variables, such as system degradation, which accounts for the fact that panels lose a small amount of efficiency each year. It also models energy price inflation, which is critical for showing how your savings will grow as utility rates continue to rise.
- Compare Financing Models: These tools are invaluable for comparing different financing options. You can model a cash purchase to see the fastest payback period and highest long-term savings, or you can model a solar loan to see how monthly payments and interest costs affect your total ROI. This helps you make a strategic financial decision that works for you.
Why You Should Run the Numbers Yourself
Using a solar ROI calculator is an essential step in your due diligence. It empowers you to:
Avoid Suboptimal Sizing: The calculator helps you avoid the common mistakes of under-sizing or over-sizing your system. Under-sizing means you won’t meet your energy needs, while over-sizing can lead to unnecessary costs. By running different system sizes through the calculator, you can find the ideal system that perfectly matches your energy consumption and financial goals.
Validate Installer Proposals: When you get a proposal from an installer, you can plug their numbers into a calculator to independently verify their projected savings. This ensures the proposal is realistic and helps you make a more informed decision.
Key Input Variables in an ROI Calculator
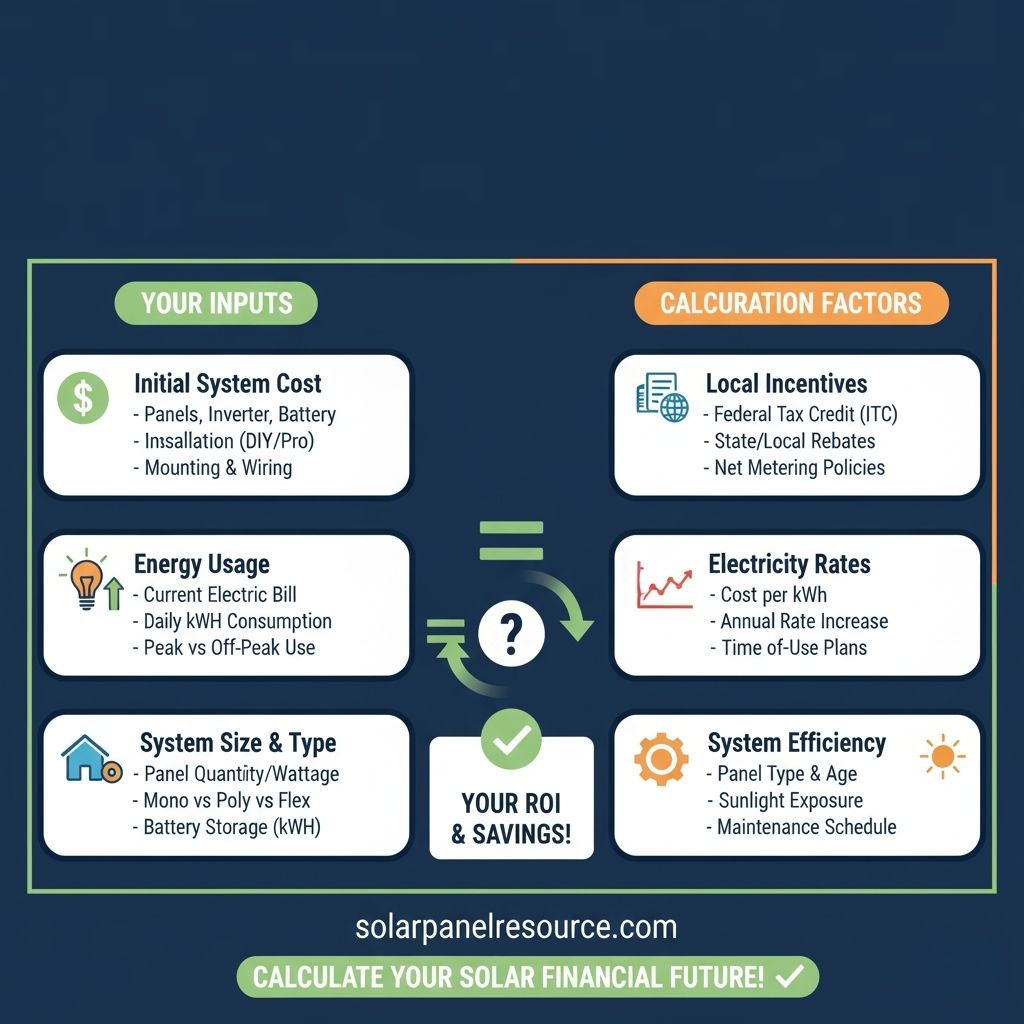
A solar panel system is a long-term financial investment, and to accurately project its return, you need to use a model that accounts for every key variable. An accurate ROI model goes beyond a simple cost-benefit analysis by incorporating a variety of technical and financial inputs that change over time and are unique to your location.
1. The Cost of the System
Your first input is the total installation cost. This isn’t just the price of the equipment; it includes labor, permitting, and inspection fees. A professional proposal will break down these costs for you. However, the sticker price is only one part of the equation. A key driver of your ROI is the total value of your federal and state incentives, such as the 30% federal Investment Tax Credit (ITC). This credit is a direct deduction from your tax liability, which can reduce your project cost by thousands of dollars and significantly shorten your payback period.
2. The Value of the Energy
Your savings are determined by how much energy your system produces and how much that energy is worth.
- Electricity Rates: You must know your current utility rate and, just as importantly, the projected rate escalation. While no one can predict the future, a conservative estimate of 3-5% annual escalation is standard in the industry. As utility rates rise, the value of your solar power increases, accelerating your payback.
- System Size and Output: The size of your system, measured in kilowatts (kW), determines its expected annual yield. Professional calculators validate this by using location-specific solar radiation data from sources like the National Renewable Energy Laboratory (NREL) to accurately estimate how much energy your system will produce.
3. Long-Term Performance and Financing
An accurate ROI model accounts for the long-term realities of a solar system. Modern panels have a low but consistent degradation rate, typically between 0.5%-0.8% annually. This means your system will produce slightly less power each year, a factor that must be included in any long-term savings projection.
Finally, your financing terms play a huge role. The ROI for a cash purchase will be different from that of a solar loan or a lease. A professional calculator can model all these scenarios, including loan interest rates and down payments, to show you the true financial performance of your solar investment over its lifetime.
How the ROI Calculation Works: Step by Step
Understanding how a solar ROI is calculated is key to making an informed decision. The process is not a simple “price divided by savings” equation. Instead, it’s a dynamic, long-term projection that models the flow of money in and out of your solar investment year by year. This comprehensive approach is what a professional financial model provides.
The Step-by-Step Calculation Process
- Start with the Upfront Cost: First, you determine the total cost of your system, including all equipment, labor, and permitting fees. From this, you subtract all available incentives, like the federal Investment Tax Credit (ITC), to arrive at your net upfront cost. This is the true price of your investment.
- Model Year-One Savings: Next, you calculate the energy your system is expected to produce in its first year. This figure, often modeled using tools like the NREL PVWatts Calculator, is then multiplied by your current utility rate to get your first-year savings.
- Account for Future Changes: This is where an accurate model becomes invaluable. Each year, it automatically adjusts for two critical factors:
- System Degradation: It reduces the system’s energy production by a small, consistent percentage (typically 0.5-0.8% annually) to reflect the natural decline in panel efficiency over time.
- Rate Escalation: It inflates your utility rate by a projected percentage (3-5% is standard) to show how your savings will grow as the cost of grid electricity rises.
- Incorporate Financial Details: If you’re financing your system, the model deducts your annual loan payments from your savings.
- Sum It All Up: By summing your cumulative cash flows year after year, the model can pinpoint exactly when your savings will equal your net upfront cost.
The Key Outputs of a Financial Model
Internal Rate of Return (IRR): This is a more advanced metric that shows the annual rate of return on your solar investment, expressed as a percentage. It is a powerful tool for comparing the financial performance of a solar system to other investments, like a stock market fund or a real estate property.
Payback Year: This is the most straightforward metric. It’s the year in which your cumulative savings from the solar system finally pay off the initial net cost of the system.
Total Lifetime Savings: This is the total amount of money you can expect to save over the entire 25- to 30-year lifespan of your system. This metric shows the true long-term value of your investment.
Example Scenario: 6 kW System in a Moderate Solar Region
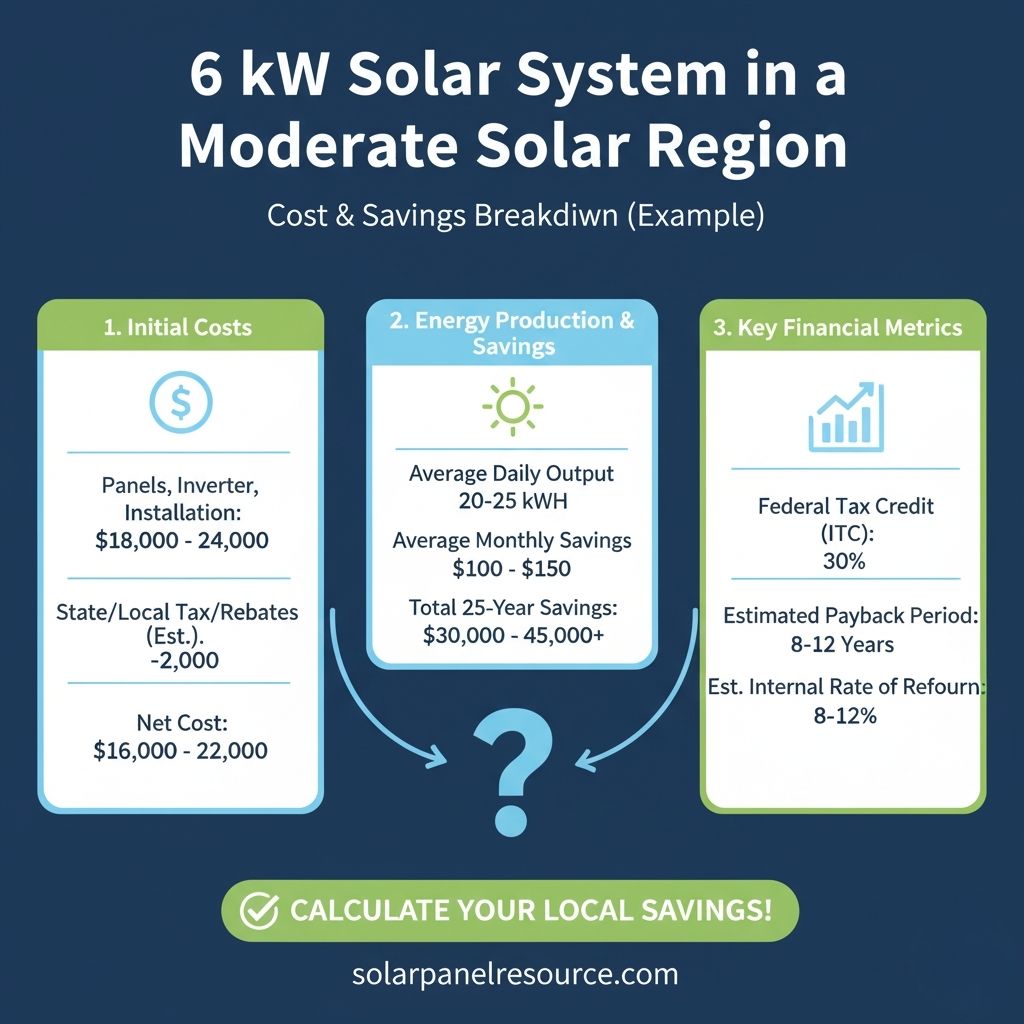
For homeowners in a moderately sunny region, the financial case for solar in 2025 is compelling. Based on a professional financial analysis, here is a typical scenario that brings the numbers to life.
The Upfront Investment
Let’s assume a total system cost of $18,000 before incentives. This figure covers the cost of the equipment (panels, inverter, and racking), labor, and all permitting and inspection fees. Your first big win is the 30% federal Investment Tax Credit (ITC), which reduces your tax liability by $5,400. This brings your net upfront cost down to just $12,600. This is your true out-of-pocket investment and the number you’ll use for all ROI calculations.
Your Annual Savings Engine
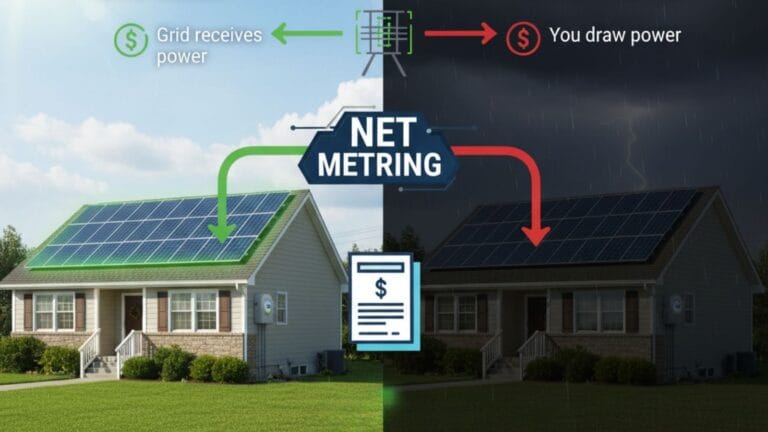
- Year One: Based on an estimated annual production of 9,000 kWh and a typical electricity rate of $0.15/kWh, your first-year savings will be $1,350. With a standard 1:1 net metering agreement, every kilowatt-hour of excess energy you send back to the grid is credited at the same retail rate you would pay to your utility, maximizing your savings.
- The Long-Term Effect: Your savings don’t stay flat. As utility rates continue to rise (a standard assumption of 3% per year), the value of every kWh your system produces also increases. This effect is powerful and accelerates your payback period. While your panels will experience a small degradation of about 0.7% annually, the rising value of your electricity more than compensates for it.
The Bottom Line: When Your System Pays for Itself
This model shows that the payback period for this system will be between 8 and 9 years. At this point, your cumulative savings will have fully covered your initial $12,600 investment. After that, your system will be generating free electricity for the rest of its 25- to 30-year lifespan. This translates to total lifetime savings of $25,000 to $30,000. When compared to other investments, this scenario yields a healthy Internal Rate of Return (IRR) of 7%–9%, making it a secure and profitable addition to your home.
Factors That Influence Your ROI
Several critical variables, many of which are location-specific, can significantly impact your solar system’s financial performance. A seemingly small difference in one variable can drastically alter your payback period and total lifetime savings. A professional analysis will always factor in these details.
The Power of Local Policy and Utility Rates
Industry research, supported by data from the National Renewable Energy Laboratory (NREL), consistently shows that the financial return on solar is heavily dependent on where you live.
- Net Metering: This is a key policy that directly affects your ROI. With 1:1 net metering, every kilowatt-hour of excess energy your system sends back to the grid is credited at the full retail rate. This effectively makes your home a mini-power plant, allowing you to “bank” your solar energy for when you need it at night or on cloudy days, and this credit can significantly accelerate your payback.
- Utility Rate Escalation: A higher annual increase in your utility’s electricity rates can dramatically boost your ROI. As the cost of grid power rises, the value of the free electricity you produce increases, helping your system pay for itself faster.
The Impact of Equipment and Financing
Beyond your local policies, the choices you make about equipment and financing can make a major difference.
- Panel Efficiency and Degradation: While all panels experience some degradation, premium panels with lower degradation rates (some as low as 0.3% annually) will produce more energy over their lifespan, improving your long-term savings.
- Financing Terms: A low-interest solar loan can be a powerful tool. By financing your system, you can reduce your upfront cost to zero and still generate monthly savings that exceed your loan payments. This allows you to start saving money from day one without a large initial investment.
When evaluating a proposal, ensure your installer has accurately modeled these variables. A professional will provide a transparent analysis that gives you confidence in your decision and helps you secure the strongest possible return on your investment.
Common Misconceptions About Solar ROI
While many people have heard about the financial benefits of solar panels, several common myths about ROI can set unrealistic expectations. Understanding the reality behind these misconceptions is key to making a truly informed decision.
Myth 1: “Solar panels pay for themselves in 3-4 years.”
Reality: While this can happen in rare cases with extremely generous incentives, the typical payback period for a residential solar system in the U.S. is 6 to 12 years. Regions with high electricity costs and strong state incentives, like California or New Jersey, often see paybacks on the lower end of that range. However, for most of the country, a payback of 7-10 years is a much more realistic expectation. The good news is that after that point, your electricity is essentially free for the remainder of your system’s 25- to 30-year lifespan.
Myth 2: “Battery storage significantly increases ROI.”
Reality: A home battery system is a huge asset for resilience and energy independence, but it often extends your financial payback period. The average cost of a residential battery system in 2025 is between $10,000 and $19,000 fully installed, which is a significant addition to the total project cost. While batteries allow you to use your own solar power at night and during power outages, the financial savings from “time-of-use” arbitrage (charging the battery when electricity is cheap and using it when it’s expensive) are often not enough to justify the high initial cost. The primary value of a battery today is peace of mind, not a faster ROI.
Myth 3: “All solar calculators yield the same result.”
Reality: The output of any solar calculator is only as good as its underlying assumptions. Different calculators use different values for key variables, which is why their results can vary widely. For a truly accurate estimate, you should always verify the assumptions being used. Look for these key variables:
- Electricity Price Escalation: This is the projected annual increase in your utility rates. A calculator using a 5% inflation rate will show a much faster payback than one using 2%.
- System Degradation: Panels naturally lose efficiency over time. An accurate calculator will model this gradual decline, typically 0.5% to 0.8% annually, to provide a realistic projection of your long-term energy output.
- Incentives: Ensure the calculator includes all relevant incentives for your area, from the federal Investment Tax Credit (ITC) to any local rebates or production credits.
By using a transparent calculator and validating its assumptions, you can get a trustworthy estimate that will help you plan your solar investment with confidence.
Choosing a Reliable Calculator Tool

When you’re ready to get a quote for a solar system, using a reliable calculator from a trusted source is the best way to ensure the proposal is accurate and tailored to your specific needs. These tools use verified data and sophisticated modeling to provide a clear, unbiased picture of your solar investment.
The Foundations of a Reliable Calculator
A trustworthy solar calculator is built on a foundation of verified, up-to-date data. It avoids vague assumptions by using specific information to model your system’s performance.
- Geographic Solar Irradiation Data: A professional tool will use hyper-local solar radiation data. Instead of using a simple national average, it pulls from verified sources like the National Renewable Energy Laboratory (NREL) PVWatts® Calculator to accurately predict how much sunlight your roof will receive throughout the year, factoring in everything from your latitude to local weather patterns.
- Editable Input Parameters: A good calculator puts you in control. It allows you to adjust key variables like your monthly electricity consumption, the proposed system’s size, and even the type of financing you’re considering. This lets you run different scenarios to find the perfect fit for your budget and energy goals.
Transparency and Clarity
The best tools are transparent about their methodology. They provide summaries of their key assumptions so you know exactly how the numbers were generated.
- Presenting Clear Metrics: A reliable calculator will present its output in a clear, easy-to-understand format. It will give you the most important metrics, including your payback period, total lifetime savings, and your project’s Internal Rate of Return (IRR). This empowers you to compare a solar investment to other financial opportunities and make a decision based on hard numbers.
By relying on these types of tools, you can ensure that you’re making a confident and informed decision about your solar investment.
Steps to Use the Calculator Effectively
Performing a professional-level ROI analysis is about more than just plugging numbers into a simple calculator. It requires a meticulous approach to data collection and an understanding of how small changes in inputs can affect your long-term savings. Here is a professional checklist to ensure your solar ROI is as accurate as possible.
1. Collect Accurate, Granular Data
Your first and most crucial step is to gather precise, location-specific data.
- Historical Electricity Usage: Don’t rely on a simple monthly average. Collect your utility bills for the past 12 months to capture seasonal variations in your energy consumption. Your usage will be drastically different in the summer (with heavy AC use) than it is in the winter.
- Up-to-Date Local Grid Prices: Your utility rate is more complex than a single number. Get your most recent bill and identify your tariff structure, including any time-of-use (TOU) rates, which can vary significantly throughout the day. This is essential for accurately modeling your savings.
2. Understand Your System’s Performance
The equipment you choose has a direct impact on your long-term ROI.
- Degradation Rates: All solar panels degrade over time, but the rate varies by manufacturer and technology. While an industry standard is around 0.5-0.8% annually, premium brands (like SunPower and REC) often have warranties guaranteeing degradation rates as low as 0.25% annually. Ensure your calculator uses a rate that matches your chosen panel brand, especially if it’s a pre-2025 model.
- Net Metering: This is the most important policy for residential solar ROI. Verify if your local utility offers net metering and, if so, at what rate you are credited for excess energy. A 1:1 credit is ideal, but some utilities offer lower credit rates that can extend your payback period.
3. Review and Verify Your Inputs
This is where your inner analyst comes out. A professional doesn’t just trust the numbers; they test them.
- Check for Expired Incentives: Your installer will know the current incentives, but it’s important to also know if any have recently expired. For example, some states have phased out cash rebates in favor of a simpler tax credit model. Understanding these historical changes helps you spot any outdated information and ensures you’re not missing a new, valuable program.
- Run Sensitivity Scenarios: A single ROI projection is a best-case scenario. To get a more realistic picture, run a sensitivity analysis. Model what your ROI would look like if your utility’s rates increase by 2% instead of 4%, or if your system’s output is slightly lower than expected due to unmodeled shading. This gives you a range of potential outcomes and provides a more realistic view of your investment.
Is Solar Worth It in 2025?
An accurate financial model of a solar panel system will consistently show a compelling return on investment. While some numbers may seem too good to be true, the underlying physics and economics of solar energy make it a sound long-term investment.
The Realistic Financial Picture
A well-modeled solar project typically yields an Internal Rate of Return (IRR) of 7%–12%, which is a highly competitive return when compared to a traditional stock market investment. This strong return is fueled by a few key factors:
- Grid Parity: In 2025, the Levelized Cost of Energy (LCOE) for residential solar is often at or below the cost of grid electricity, especially in areas with high utility rates. This means the energy you produce from your panels is already cheaper than what you’re buying from the utility, creating immediate savings.
- Strong Incentives: With the 30% federal Investment Tax Credit (ITC) and robust state-level incentives, the payback period for a grid-tied system is typically between 6 and 10 years. The combination of these tax credits and strong net-metering policies—where you are credited at the full retail rate for excess power—can accelerate your savings significantly.
The Value of Resilience Over Return
While a home battery system can be a valuable addition, it’s important to be realistic about its financial impact. Batteries add a significant upfront cost, and their financial return is not as direct as a grid-tied solar system. The primary benefit of a battery is not a faster ROI, but rather the invaluable security of backup power during an outage and the ability to reduce your reliance on the grid. It’s a strategic investment in peace of mind and energy independence.
The Final Step to a Confident Decision
Before you sign a contract, always request a full sensitivity analysis from your installer. This professional-level assessment should show you a range of outcomes for your investment, factoring in different scenarios like fluctuating electricity prices or slightly lower-than-expected production. This transparency ensures that the proposal you’re viewing is not just a best-case scenario, but a realistic and trustworthy projection of your solar future. With proper planning and due diligence, solar energy in 2025 and beyond is a solid investment for any homeowner.
For a deeper look into payback periods and calculation methods, see our detailed guide on solar panel payback period.

Solar Energy Enthusiast & Renewable Energy Researcher
Vural’s journey into solar energy began four years ago, driven by frequent power outages and high electricity bills at his own home. He has since gained hands-on experience with both personal and commercial solar projects. At solarpanelresource.com, Vural shares his real-world insights and in-depth research to guide homeowners and business owners on their own path to energy independence.